Ether’s active addresses, trading volumes have decoupled from rising prices

Ether’s daily (24-hour) active addresses, a proxy for user participation, peaked above 670,000 at the end of October and has been declining ever since, diverging from the cryptocurrency’s rising price.
Network usage affects the demand for cryptocurrency and can influence its price. An uptick in the number of active addresses along with a price increase is said to confirm an upward trend. So, analysts often question the sustainability of price gains whenever the price rally is accompanied by a drop in active user participation on the network.
Another reason to be cautious is the strong divergence between prices and trading volumes seen in the chart below.
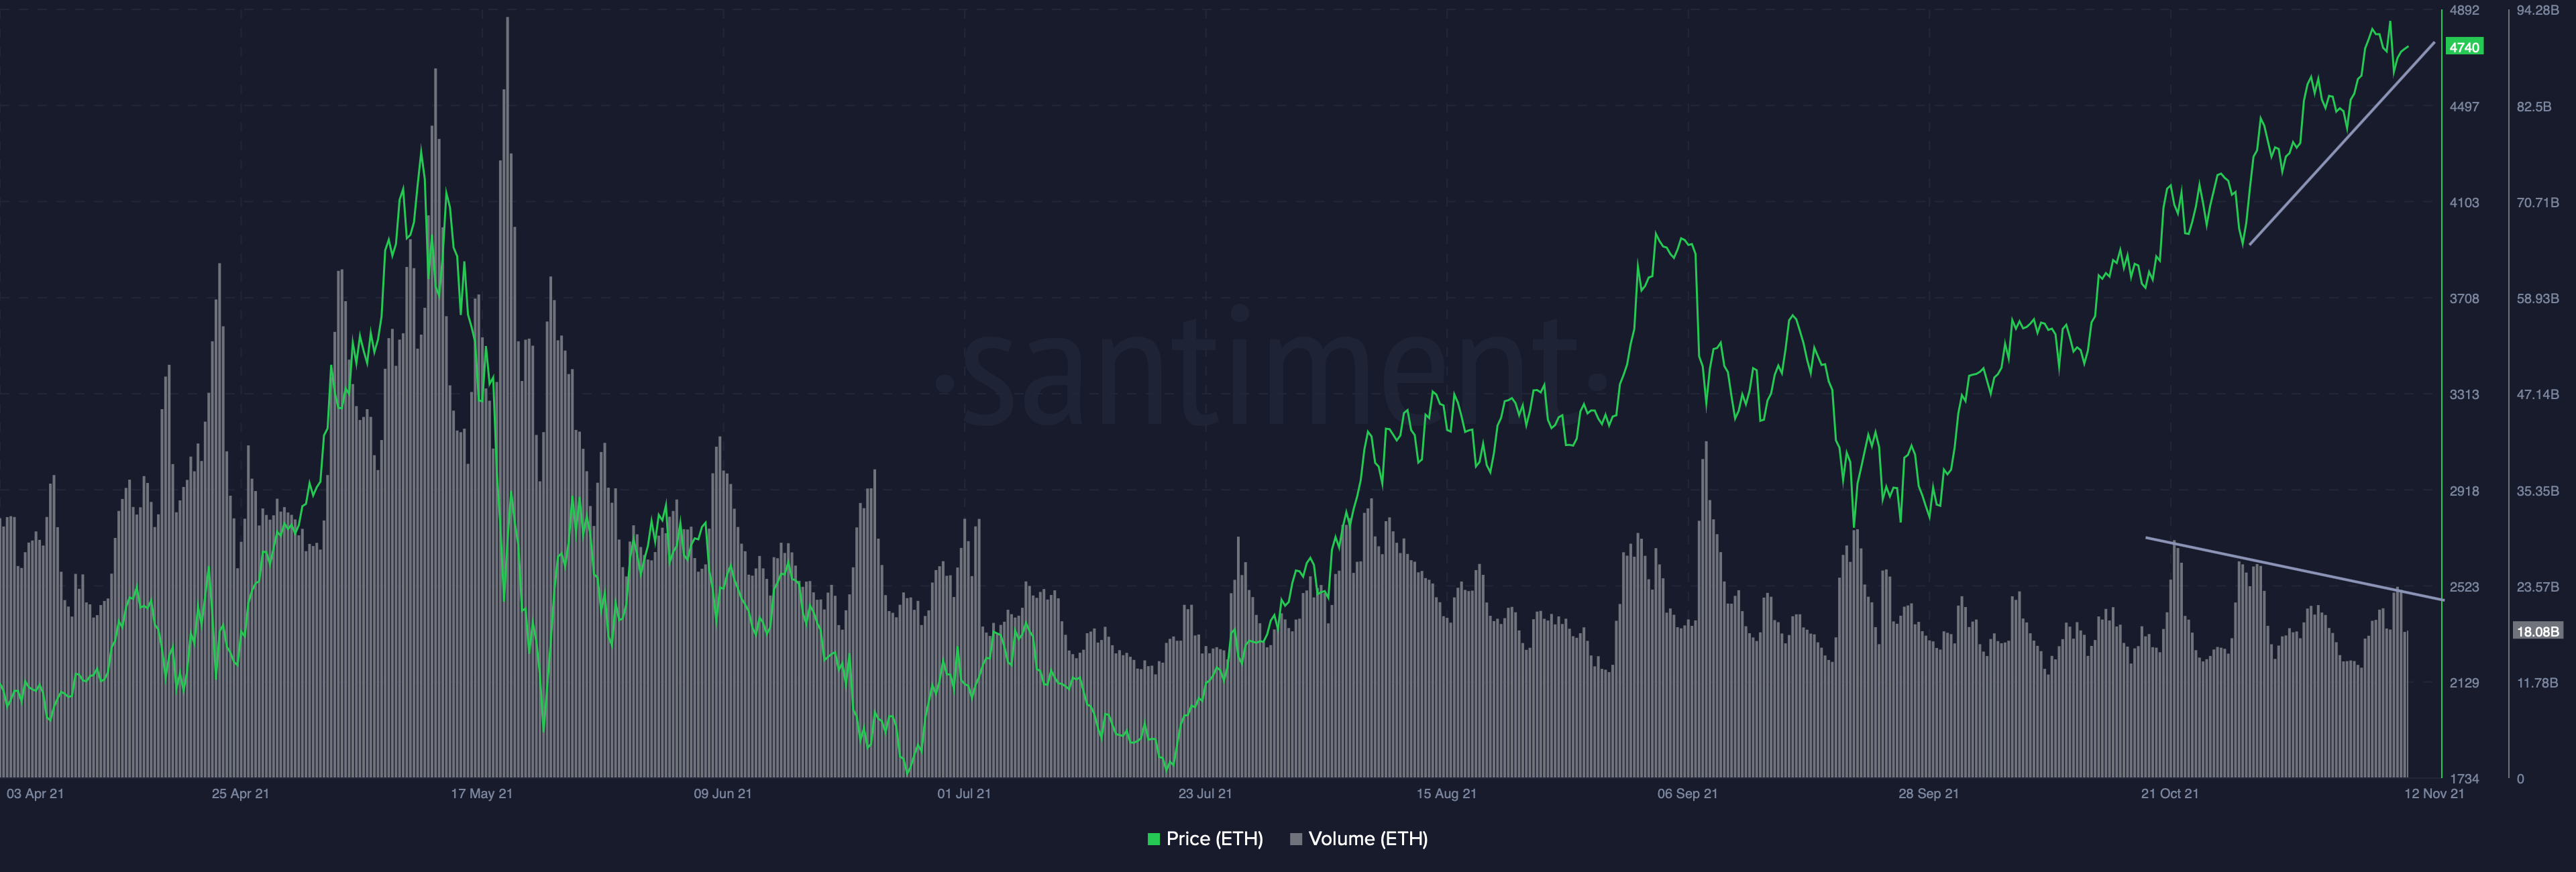
While ether continues to chart higher lows and higher highs, a sustained pick-up in daily trading volumes remains elusive. According to technical analysis theory, a low-volume rally is often short-lived.
A similar bearish divergence is seen in ether’s social volume, a metric representing the degree of crowd chatter about ether on various social media channels, including Telegram groups and crypto subreddits.
“A bunch of long-lasting divergences is pointing us to the idea that we need to go down,” Santiment noted in a market insights post published early on Friday. “These are really worrying.”
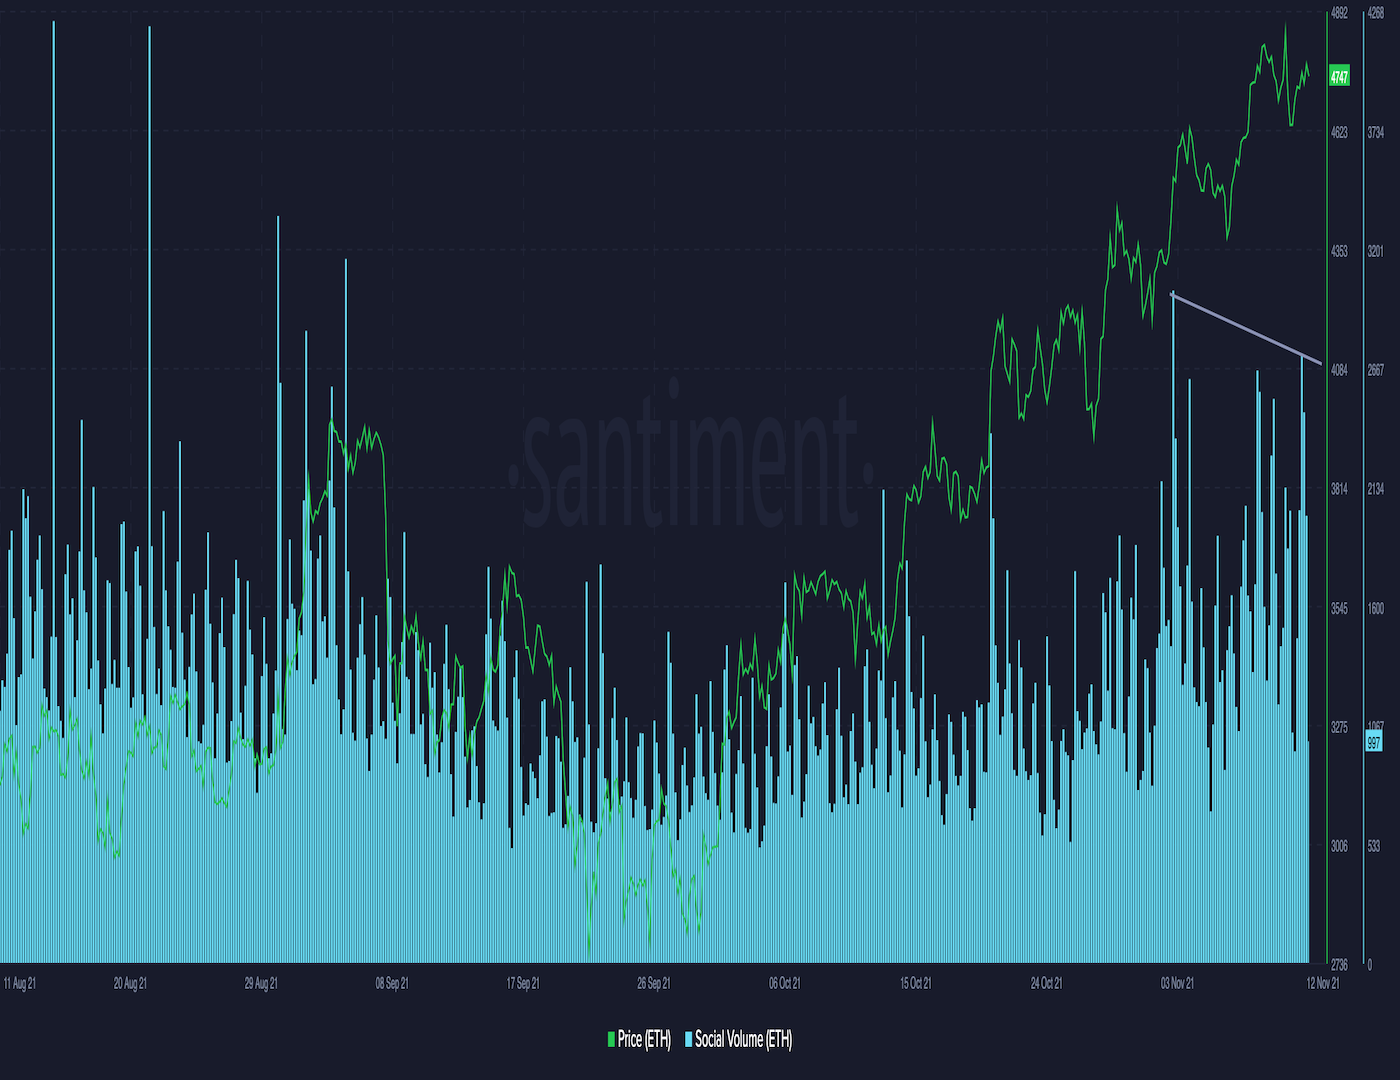
“There is 50/50 chance market quite often moves up one more time after divergence... just to confuse traders,” Santiment said, adding that there could be one more push higher before a crash.
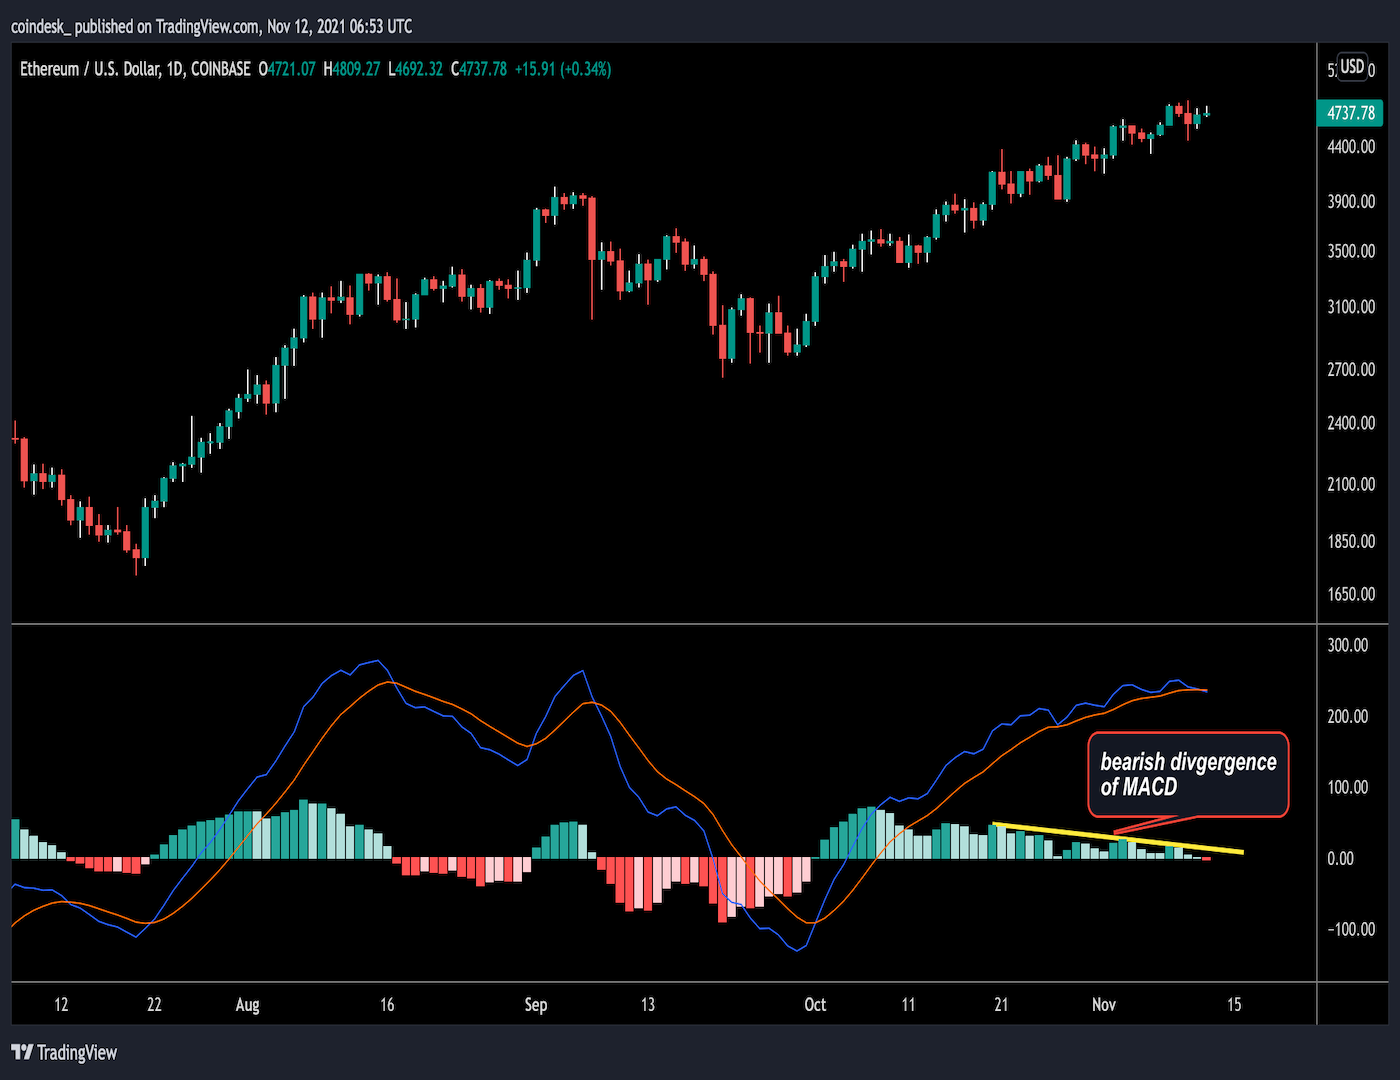
Ether’s technical studies also indicate uptrend fatigue.
The daily MACD histogram, an indicator used to gauge trend strength and trend changes, is predicting lower highs, contradicting the higher price trend. The divergence indicates a weakening of bullish momentum and often precedes price drops.
That said, a pullback, if any, could be shallow and short-lived, as ether may be facing a supply squeeze, as noted in Tuesday’s First Mover newsletter.
Ether was trading near $4,745 at press time, representing a 10% gain for the month. The cryptocurrency reached a lifetime high of $4,865 on Wednesday.


No comments:
Post a Comment